What is the app that shows the audio file spectrum?
An audio spectrum is a visual representation of an audio signal. It shows the distribution of frequencies in the audio over time. Audio spectrums allow you to literally see sound through graphical waveforms. This provides helpful visual cues about aspects like volume, frequencies, transients, and more.
There are many applications available today that can generate real-time visualizations of audio spectrums. These audio spectrum analyzer apps take an audio input signal and convert it into graphics that fluctuate with the music. They essentially turn sound into dynamic art. Audio spectrum visualizers can be used for a variety of purposes, such as music production, DJing, entertainment, and more.
What is an Audio Spectrum?
An audio spectrum is a visual representation of an audio signal that displays the various frequencies present in the sound over time. It provides a graphical view of the amplitude or intensity of each frequency within an audio file.
Audio spectrums analyze the frequencies and amplitudes that make up a sound. The x-axis represents the different frequencies or pitches from low to high, while the y-axis represents the volume or amplitude at each frequency. Peaks along the spectrum indicate frequencies that are more prominent in the audio sample.
By visualizing the spectrum, you can see which frequencies are emphasized and how the different frequencies interact with each other. This allows you to analyze and understand the tonal characteristics of any given sound. The visualization provides an insightful overview of the sound that goes beyond just listening.
Common visualizations include line graphs, waterfall graphs, and animated bars that pulse and react to the music. Overall, audio spectrums convey important frequency and amplitude data that gives a comprehensive representation of an audio signal.
Why Visualize an Audio Spectrum?
Visualizing an audio spectrum allows for analysis of the audio characteristics and can help identify issues or optimize the audio. By converting the audio waveform into a visual graph, aspects like frequency, amplitude, and timing become visible. This makes it easier to spot problems or room for improvement [1].
For example, a visualizer can reveal harsh spikes in certain frequency ranges that lead to an unbalanced or unpleasant listening experience. Using this information, one could apply targeted EQ adjustments to smooth out the response. Visual inspection may also uncover sections with little activity, signaling an opportunity to liven things up with some additional layers or elements.
Overall, audio spectrum visualization empowers audio editors, musicians, and other specialists to make better-informed decisions to enhance their work. The graphical format extracts key data from the auditory domain and presents it in an intuitive, accessible way. This allows not just hearing, but also seeing the audio, unlocking new creative possibilities [2].
Types of Audio Spectrum Visualizations
There are a few common types of visualizations used to represent the audio spectrum in apps:
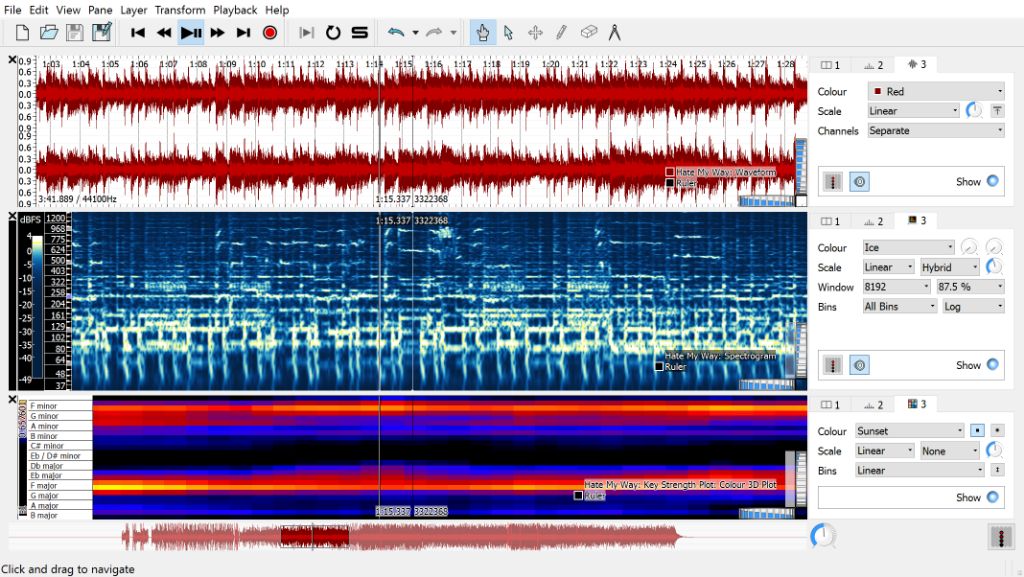
Waveform graph – This shows the waveform of the audio signal over time, displaying amplitude vs time. It provides a visualization of the raw audio waveform before any frequency analysis is applied. Waveforms are useful for visualizing tempo, rhythm, and volume changes.1
Spectrogram – A spectrogram displays frequency content of audio over time, using color or intensity to indicate amplitude at different frequencies. This provides a visual representation of timbre and harmonics. Spectrograms are useful for analyzing audio quality issues and visualizing musical notes.2
Real-time bars – These show the amplitude of different frequency bands in real-time using scrolling bars. The height of each bar represents intensity at that frequency. This gives a real-time view of the power spectrum, useful for visualizing music and identifying dominant frequencies.
Popular Apps for Visualizing Audio Spectrums
There are many great apps available for visualizing audio spectrums. Some of the most popular and highly-rated options include:
Spek – This free and open source app available for Windows, Mac, and Linux displays the acoustic frequency spectrum of audio files. It’s simple to use and offers customizable settings like frequency scale and color scheme. Spek is known for its accurate and detailed visualizations (Source).
Sonic Visualiser – Developed by the Centre for Digital Music, this free software can visualize spectrum, spectrogram, and more. It’s widely used in academic research and supports file formats like WAV, MP3, and FLAC. Users praise Sonic Visualiser for its precise graphics and analysis tools (Source).
AudioScope – Available on iOS, this app renders real-time audio visualizations through the iPhone or iPad microphone. Users mention its high responsiveness and ability to customize the waveform, color, and layout. The basic version is free while the pro upgrade unlocks additional features (Source).
There are many other excellent spectrum analyzer apps like SoundSpectrum, WavePad, and Adobe Audition for different platforms. Most specialize in distinct music visualization capabilities, analysis tools, supported file formats, and customization options.
Key Features of Audio Spectrum Apps
Audio spectrum apps offer some key features that make them useful for analyzing audio files and visualizing sound frequency data. Some of the most notable features include:
Ability to Load Audio Files
Most audio spectrum apps allow users to load audio files like MP3s, WAVs, or M4As from their device storage. This provides the raw audio data that will be visualized and analyzed by the app. Popular apps like Audio Spectrum for iOS and Sound Spectrum Analyzer for Android include file loading capabilities.
Interactive Visualization
The core feature of these apps is an interactive spectrogram that visually represents the frequency spectrum of the loaded audio. As the audio plays, users can see the amplitude and frequency plot in real-time. Controls like zooming and panning allow for close analysis. The visual graph is the main way users can “see” the audio spectrum.
Frequency Analysis Tools
In addition to the visualization, most apps provide specific frequency analysis tools. These can include frequency counters to precisely measure frequency peaks, decibel meters to measure volume, and EQ controls to isolate or mute certain frequencies. Some apps even offer custom visualizers and 3D spectrums for advanced analysis. These tools help users interpret the audio spectrum data.
How to Use an Audio Spectrum App
Using an audio spectrum app is easy once you know the basic steps. Here’s a step-by-step guide on how to load audio files, adjust views, and utilize analysis tools in a typical audio spectrum app:
1. Open the audio spectrum app on your device. Popular options include Spek, SpectrumView, and CapCut (for mobile).
2. Tap on the “Load File” or “Open” button and select the audio file you want to visualize from your device storage. Common file formats like MP3, WAV, and M4A work best.
3. Once loaded, the audio waveform and frequency spectrum will be visualized. Pinch to zoom in or out on the graphic. Swipe left or right to scroll through the song timeline.
4. Tap the settings icon to adjust the visual style, color scheme, layout, and other preferences for the graphic.
5. Use the play button to play the song. The spectrum graphic will animate in real-time based on the frequencies in the music.
6. Some apps provide analysis tools to view specific frequency ranges or see a histogram of the spectrum over time. Enable these for further inspection.
7. When finished, tap the camera icon to capture a screenshot of the spectrum graphic to share or use as cover art.
Following these basics will allow you to generate eye-catching spectrum visualizations for any audio using mobile apps. Experiment with different songs and settings for unique results each time.
Source: https://www.youtube.com/watch?v=yeWPEak6hDI
Tips for Reading Audio Spectrums
When looking at an audio spectrum visualization, there are a few things to keep an eye out for:
Look for spikes and dips, which can indicate potential issues with the audio. Spikes may represent peaks that are too loud and risk clipping or distortion. Dips may indicate frequencies that are too quiet compared to the rest of the mix. According to the article on the Speechify blog, “Mastering Audio Visualization: A Beginner’s Guide To Audio Waveforms” https://speechify.com/blog/audio-visualization-waveforms/, watching for spikes and valleys in the waveform visualization can reveal balance issues.
Try to identify the dominant frequencies in the mix. The peaks on the spectrum represent the loudest frequencies. Being able to visualize where the core energy of the audio signal lies can help inform mixing decisions, especially regarding EQ. As explained in “How Do Audio Visualizers Work?” on ContentFries.com https://www.contentfries.com/blog/how-do-audio-visualizers-work, audio visualizers allow you to see which frequencies are most prevalent in the audio.
Look for any patterns, symmetry/asymmetry, or distortions that may indicate problems. For example, one channel being much louder than the other may reveal an imbalance. According to the article by David Lu on Medium https://delu.medium.com/a-perceptually-meaningful-audio-visualizer-ee72051781bc, the visualizations can reveal information about the stereo field and help identify phase issues between channels.
Use Cases and Applications
Audio spectrum apps have many practical uses across different industries and applications. Here are some of the top use cases:
Mixing and mastering audio – Audio engineers rely on spectrum analyzers to visualize frequencies when mixing and mastering music. The spectrum helps identify clashing frequencies, imbalances in the frequency range, and other issues that need adjusting.
Diagnosing audio problems – Mechanics, electricians, and other technicians use spectrum analyzers to diagnose issues like bearing wear, electrical noise, signal interference, and more. The visual helps pinpoint the frequency range where issues occur.
Audio forensics – Investigators use audio spectrum analysis to examine evidence in areas like speaker identification, audio authentication, and enhancing distorted audio. Visualizing the frequency spectrum aids in recovering crucial details.
Conclusion
Audio spectrum apps allow users to visualize the frequency and amplitude components of audio in real-time. By displaying a visual representation of the audio waveform, these apps provide valuable insights into the characteristics of sound. Key takeaways include:
– Audio spectrums graphically depict the spectrum of frequencies that make up an audio signal over time.
– Visualizations allow users to quickly analyze aspects of audio like timbre, pitch, rhythm, and loudness.
– Spectrograms, oscilloscopes, and real-time animated bars are common visualization types.
– Popular audio spectrum apps include Spek, Sonic Visualiser, and Audio Spectrum Analyzer.
– Key features include frequency analysis, waveform views, and customization options.
– Visualizations have diverse use cases in music production, audio engineering, acoustics research, and more.
By translating audio waveforms into dynamic visuals, spectrum apps provide an invaluable window into understanding the nuances of sound. Their unique ability to visualize what is heard empowers users across many fields to evaluate, tweak and enhance audio like never before.